The nationwide Energy Mix transmitted by UK DNOs
Update May 2022 : The UK generated approximately 15% of it's electricity demands from its c.7GW nuclear capacity during 2021, a drop of 5% on the previous year. The winter of 2021 was harsher than usual, placing additional demands on power demands, meaning more was pulled from gas and renewable sources.
As we embrace innovation in renewable technology, energy storage and smart homes, you might wonder just how much energy (and what sort) is being transmitted at any given point by the DNOs to power these projects. Well, there is a place that you can find out exactly that!
Welcome to Gridwatch, a website that pulls real-time data (within 5 minutes) on the UK grid consumption throughout the day and night. The website collects data from Elexon and Sheffield University showing daily, weekly, monthly, and yearly energy usage including imported resources (from France, Ireland, The Netherlands & Belgium), giving insight into areas such as nuclear, coal, CCGT, solar, wind, hydro and others. It also presents the opportunity to deep-dive into statistical analysis since 2011, giving an opportunity to see how the consumption of power has evolved since it began.
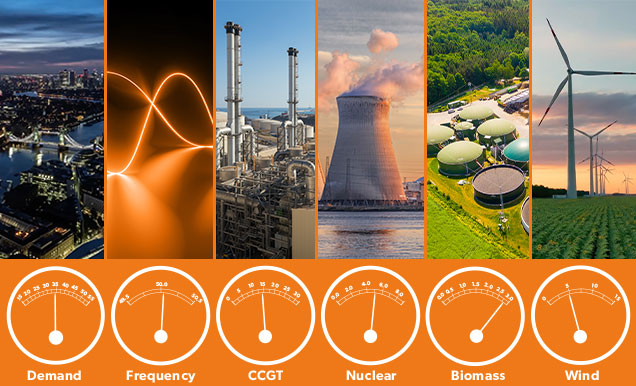
What are the main indicators in Gridwatch?
- Demand: This is referring to the energy used by the UK in its entirety but excludes exports. By knowing the demand of energy used in a country it can directly influence the required distribution of energy required, technology involved and geolocation.
When a country has an increased demand that cannot be consistently delivered an amber warning indicates that other resources such as renewables or imports can intermittently leverage the required amount. - Frequency: With most electricals running at 50Hz across homes and businesses within the UK, energy generators are synchronised to transmit electrical power distribution accordingly, though this can vary slightly.
The incline and decline in demand can have a significant strain on the frequency and generate a domino effect on the Grid. A lower frequency means the demand could potentially be higher than what is being generated so there is a constant balance required to ensure the consistency of power remains.
- CCGT: Combined Cycle Gas Turbines are an efficient use of energy and its distribution. Where the gas turbine uses a process of combining highly heated compressed air and fuel to create a motion of power to a generator and in turn convert energy into electricity.
CCGT have multiple uses when attributing to demand on the grid, due to the speed in which they can get online (generally in under one hour) they can be used during peak demand periods and where the reliability of wind is not guaranteed and requires a balance.
You might have expected to see coal as one of the indicators but it doesn’t feature in the UK power mix currently as CCGT Gas is so much cheaper to use. Coal-fired power stations have increasingly been taken offline and decommissioned because of the environmental pollution and limited fossil fuel resources – it remains a back-up in the event of demand/frequency not matching and other power sources not being able to fill the gaps within the required timeframe. - Wind: Where the use of wind farms (a group of wind turbines) both onshore and offshore are used to produce a regulated output of energy in line with grid requirements. The figure displayed on the website is the aggregated contribution of metered wind farms only.
Although wind turbines are known to generate energy up to 80% of the time, due to the constant fluctuations in wind they run at varying capacity and can be shut down during high winds to avoid damage. The largest UK offshore wind farm is the Siemens-Gamesa Hornsea One, producing up to 1218MW and located in the North Sea. The Clyde wind farm is the largest onshore, located in South Lanarkshire, Scotland and capable of producing 522MW - Biomass: These power stations use a similar process to that in gas power stations, biomass power plants mostly use direct combustion to generate electricity from organic waste materials. They are a growing percentage of the energy mix – as of 2020 the UK sits behind China, Brazil, USA, India and Germany as the biggest producers/users of bioenergy according to IRENA, the International Renewable Energy Agency.
Did you know that the largest biomass power plant is Drax Units 1-4 in North Yorkshire – it’s a 2.6GW capacity pellet fuel plant that’s been retrofitted from a coal-fired station. It retains capability for 1.29GW of coal fired power. - Nuclear: Still accounting for up to 20% of the power mix (at least until 2025 when capacity will be halved as plants are retired), there are 8 sites with a total of 15 reactors: seven sites are AGRs (Advanced Gas-cooled Reactor) including Hinkley Point, Hunterston B, Dungeness B and Torness, and one is PWR (Pressurised Water Reactor) at Sizewell B. According to the website variations in the chart readings are generally indicators of refuelling or maintenance.
Interestingly, there is no centralised measurement of solar power input into the grid – the Gridwatch data provides an estimate of capacities. Hydroelectric and Pumped Storage play a very small role in UK Power – the world leaders in this are China (with the Three Gorges Dam), Brazil (the Itaipu Dam) and USA.
At a time of technological boom, with ever-increasing demands for power and data in an on-demand, always-on environment, this data gives us the chance to break down the energy mix that powers all we do. As every data point is tracked and measured we are literally seeing history in the making.